RESEARCH & DEVELOPMENT PROJECTS
SLR Portugal Viewer
This work aims to contribute to the assessment of the coastal vulnerability of Sea Level Rise (SLR) and floods caused by occurence of extreme events, which is fundamental on supporting the definition of Strategies for Climate Change Adaptation.
The scenarios for 2025, 2050 and 2100 were evaluated with different return periods of extreme events, for which Physical Vulnerability Cartography of the Continental Atlantic Coast of Portugal was produced, based on the zones that will be affected by SLR.
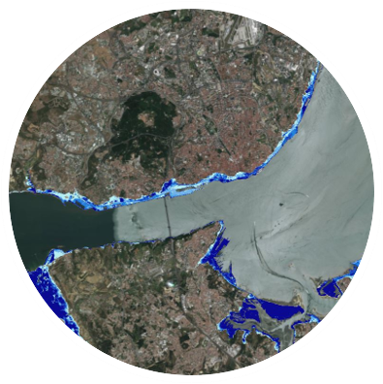
Coastal Flood
Corresponding to 5 levels of confidence that are separated by 20% flood probability intervals (conditional probability, conditioned to the central estimate of the SLR projection).
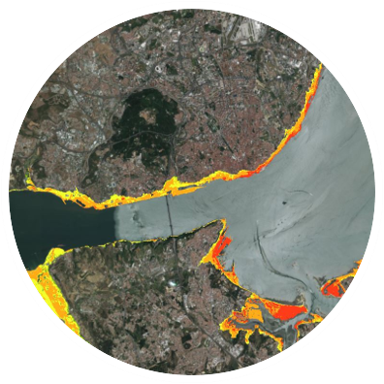
Physical Vulnerability
Corresponding to the physical susceptibility of flood. Parameters: Flood Hazard, Hydrographic Network, Coastline Type, Distance to Coast Line, Geological Drift and Land Use.
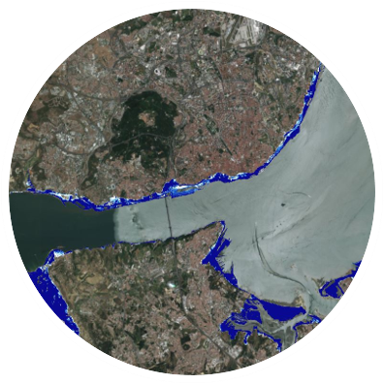
Frequent Flood
Represents the areas that will be frequently submerged in a permanent basis for future scenarios, due to the MSLR. Represents the additional intertidal zone.

Demographic Analysis
Based on data from Censos2011 and Censos2021, the number of Buildings and the Residents in the coastal areas classified as Vulnerability, by each administrative unit (district and county).
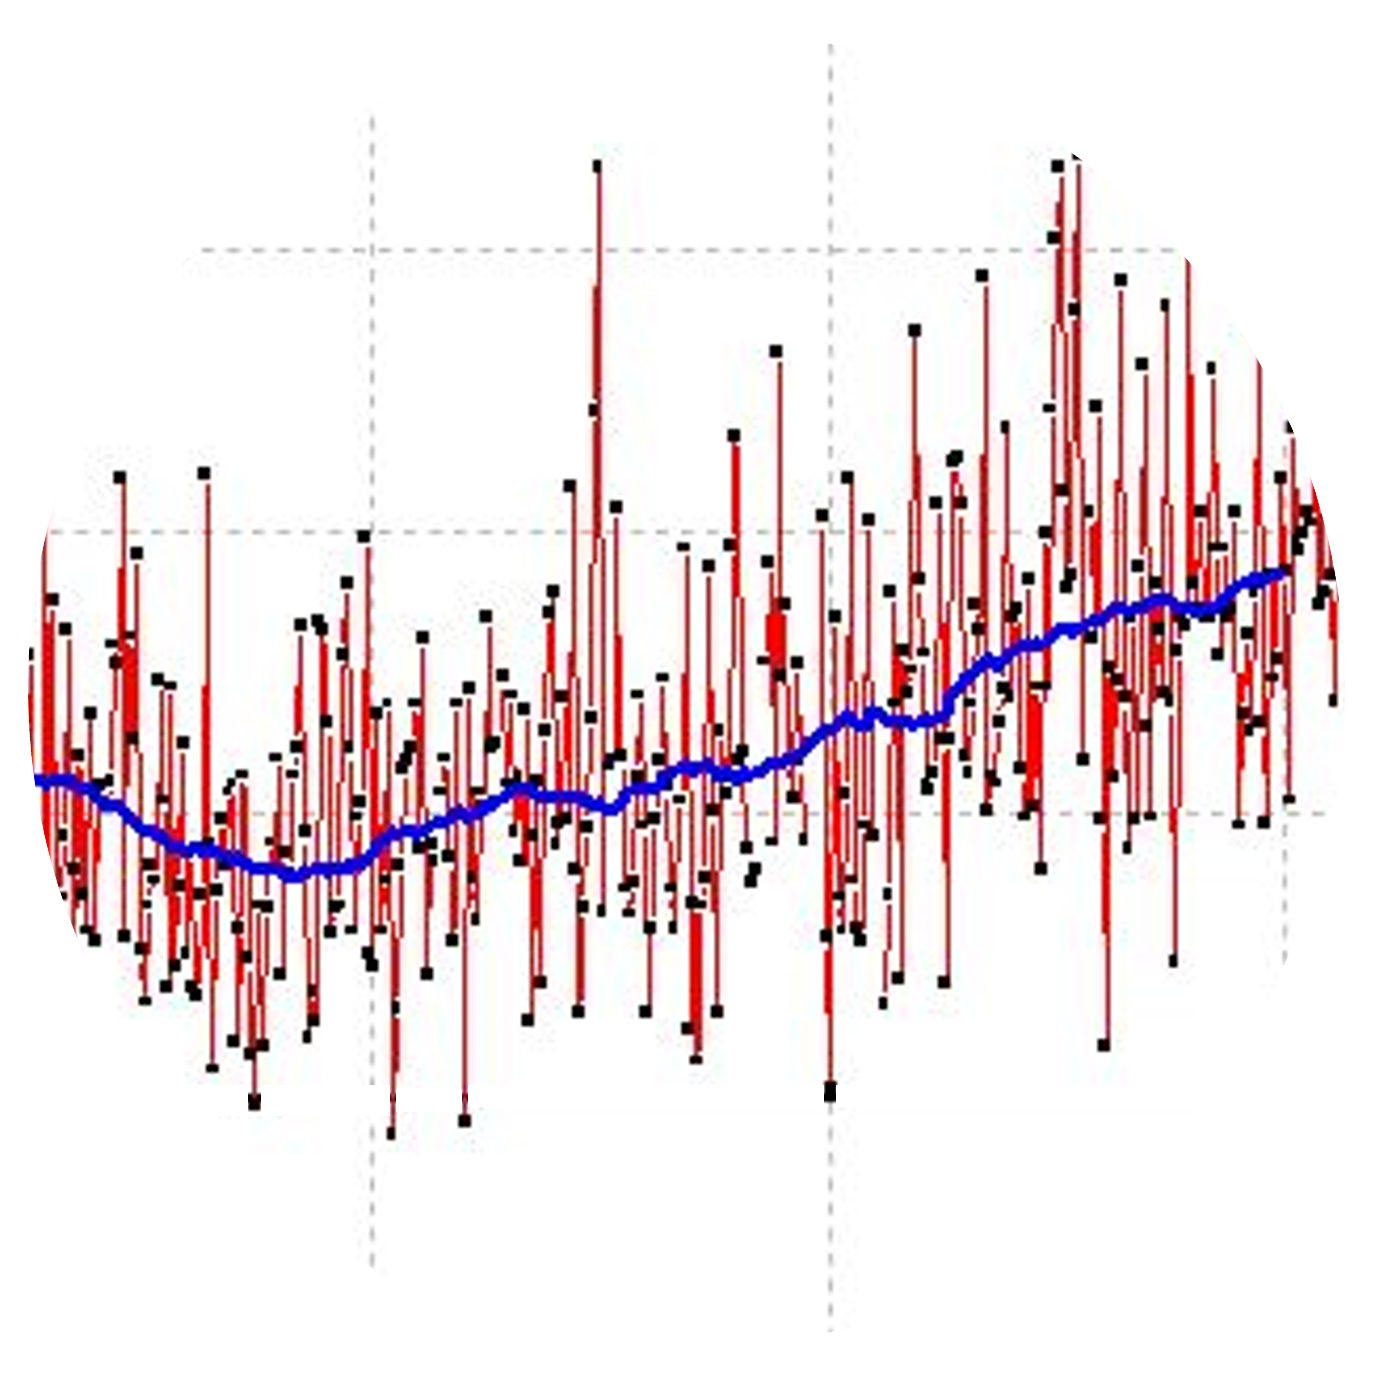
Mean Sea Level Variation
Monitoring the evolution of the MSL variation, with tide gauges data and satellite altimetry data (on the continental Atlantic coast). The entire analysis has allowed to keep the evaluation of Sea Leval Rise (SLR) rates up to date, as well as to better understand and model the mechanisms that are related to the non-linear variation of sea level, in all its components, over time .
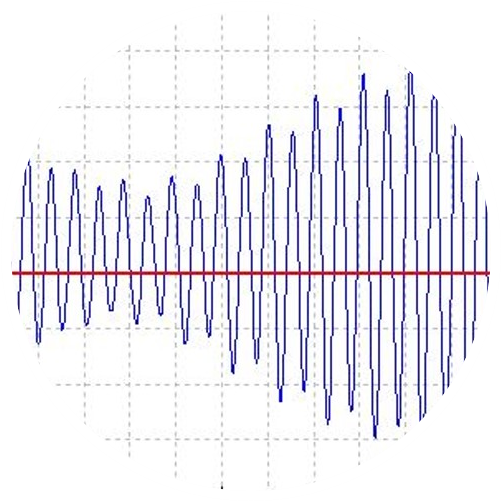
The Tide Models are the result of the harmonic analysis applied to the annual hourly records of the tide gauges of several ports, which results in a set of harmonic constituents with which the Tide Forecast and respective Tide Tables are made. As well as the tide and storm surge extreme analysis, using the simple Gumble distribution function on the maximum time and storm surge annual series, to obtain a GEV - Generalized Extreme Values.
MSL Monitoring
Monitoring of the MSL through time series (monthly and hourly) with tide data and satellite altimetry data.
Tide observation and modeling
Observation and numerical modeling of tides in several tide gauge ports on the Portuguese coast (with data from DGT, IH and IPMA).